

Dynamic Graphic Properties
As described in the dynamic graphics overview topic, different properties of graphic elements can be set to change on data values. The property options depend on the element type. Properties available are:
- Dynamic Vector Graphic properties: color, hide/show, image size, inner volume, rotation
- Dynamic Raster Graphic properties: size, rotation
- Dynamic Text properties: text itself, color, hide/show, font size, rotation
Dynamic Graphic Color Property
To use the color property, first turn it on (orange highlight below)
- Set the base or 'actual' value against which the color scale will be applied (purple arrow). This value may have already been set as the main base value for the entire element (black highlight). In which case, you can reuse the same "formula". If not, set a new one as needed.
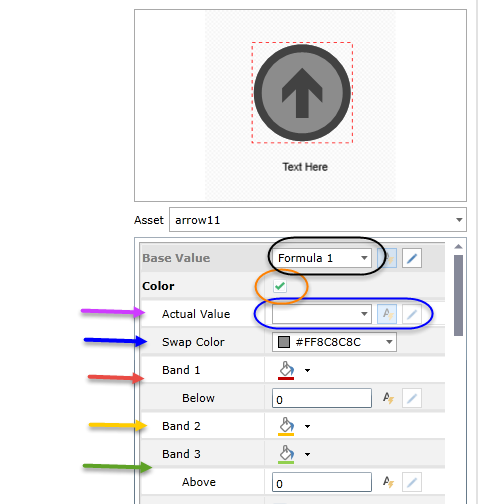
- Choose the swap color (blue arrow). The color is used as a way to select the colored parts of the graphic element that will be changed based on the data driven results for the actual.
- Select the lower band (red arrow). Choose both the lower band color and the value BELOW which the color will apply. The setting for the "below" value is identical to the base value exercise.
- Select the mid bad (yellow arrow). Here, simply select the middle tier color.
- Select the upper band color (green arrow). Choose both the upper band color and the value ABOVE which the color will apply. The setting for the "above" value is identical to the base value exercise.
Dynamic Graphic Hide/Show Property
To use the hide/show property, first turn it on.
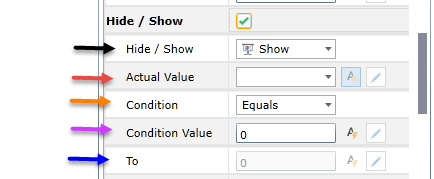
- First, decide on the initial state of the graphic: either its showing or hidden (black arrow).
- Then set the base or 'actual' value against which the hide/show logic will be applied (red arrow). The approach here is the same as for all other properties as described here.
- Set the comparison operator that will be used when comparing the condition value to the actual value. (orange arrow)
- If the users chooses the "between" condition, the condition value change to a "from" "to" range option (blue arrow).
- Choose the condition value against which the actual will be compared (purple arrow). The setting for the "condition" value is identical to the base value exercise.
- Set the optional "To" value for the between range comparison (blue arrow). The setting for the "to" value is identical to the base value exercise.
Dynamic Graphic Size Property
To use the size property, first turn it on
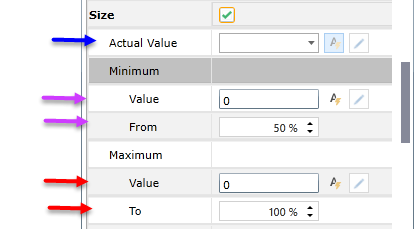
- Set the base or 'actual' value against which the sizing logic will be applied (blue arrow). The approach here is the same as for all other properties as described here.
- Select the minimum size used in the sizing range (purple arrows). The setting for the "minimum" value is identical to the base value exercise.
- Set the "From" value to the smallest percentage value the size of the element should be set to when the minimum is reached. If this is text, the value is represented as font size.
- Select the maximum size used in the sizing range (red arrows). The setting for the "maximum" value is identical to the base value exercise.
- Set the "To" value to the largest percentage value the size of the element should be set to when the maximum is reached. If this is text, the value is represented as font size.
Dynamic Graphic Volume Property
"Volume" represents a color option that will recolor the targeted item. The 'size' of the color or volume effect represents how much of the targeted item is colored compared to the "counter" color.
To use the volume property, first turn it on.
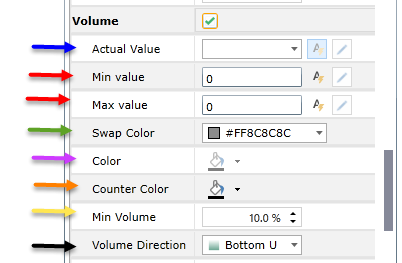
- Set the base or 'actual' value against which the volume logic will be applied (blue arrow). The approach here is the same as for all other properties as described here.
- Select the maximum and minimum values that will drive the range against which the actual will be compared (red arrows). The setting for the "maximum" and "minimum" values are identical to the base value exercise.
- Choose the swap color (green arrow). The color is used as a way to select the colored parts of the graphic element that will be changed based on the data driven results for the actual.
- Choose the 'volume' color that represents the amount of coverage or volume (purple arrow). This property may be disabled if the color property itself is in use.
- Choose the 'counter' color that represents the non-coverage (orange arrow). This property may be disabled if the color property itself is in use.
- Choose the floor for the volume amount. this is useful when the minimum volume should not be shown as nothing - but instead a small percentage of the range.
- Choose the direction in which the volume coloring effect will be applied (from color to counter color).
Dynamic Graphic Rotation Property
To use the rotation property, first turn it on.
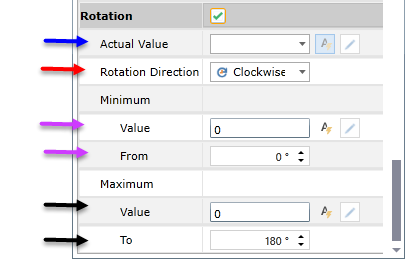
- Set the base or 'actual' value against which the rotation logic will be applied (blue arrow). The approach here is the same as for all other properties as described here.
- Choose the direction in which the rotation effect will be applied (clockwise or counter-clockwise).
- Select the minimum value used in the rotation range (purple arrows). The setting for the "minimum" value is identical to the base value exercise.
- Set the "From" value to the smallest degree (arc) that the element should be rotated to when the minimum is reached.
- Select the maximum value used in the rotation range (black arrows). The setting for the "maximum" value is identical to the base value exercise.
- Set the "To" value to the largest degree (arc) that the element should be rotated to when the maximum is reached.
Home |
Table of Contents |
Index |
User Community
Pyramid Analytics © 2011-2022